Co-visualizing bulk and single-cell data

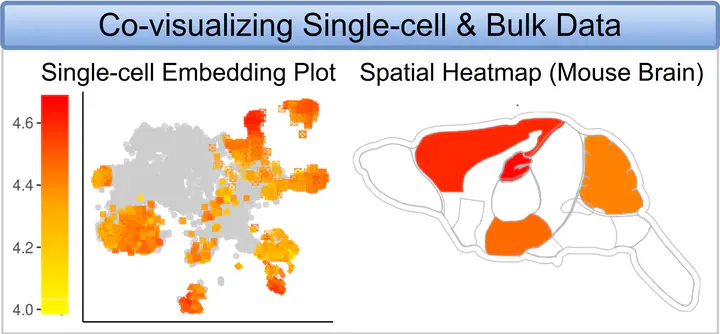
The spatialHeatmap software provides novel functionalities to integrate tissue and single-cell data by visualizing them in composite plots that combine SHMs with embedding plots of high-dimensional data. Identical colors indicate matching components between SHM and embedding plots. The resulting spatial context information provides insights into the tissue-level organization of single-cell data, or vice versa. For co-visualizing single-cell data with tissue features, the individual cells of the single-cell data map via their group labels to the corresponding tissue features in an SVG instance initialized from an aSVG file. A translation map can be used to avoid manual relabelling if the feature labels in an aSVG are different than the corresponding cell group labels. Several dimensionality reduction algorithms are to generate single-cell data embedding plots, including PCA, UMAP and tSNE.